Moving Averages are included in all types of data analysis, and isn’t just for technical analysis across financial assets.
In statistics, Moving Averages by definition are simple mathematical formulas designed to better analyze individual data points by averaging out the data using a variety of methods. Combined with time-series data, it can provide detailed insight into trends that are forming or waning in momentum.
In technical analysis, the same mathematical formulas apply using the candle price close of an asset across a series of time periods to produce a visual tool that traders can use to signal when or not to take a position or enter a trade. The same Moving Averages can also be used to plan exit points or set stop-loss levels.
Moving Average Definition
A Moving Average is another technical analysis tool that traders can add to their toolset alongside charting price patterns, candlestick formations, and other technical indicators and oscillators.
These Moving Averages smooth out sharp fluctuations on the price charts of financial assets to filter out noise and other market chop, providing traders with a visual representation of the data.
It is often considered a lagging indicator due to it being based on previous price action and results in late, but accurate signals.
Why the Moving Average Matters
Moving Averages can be used to identify trend direction, determine support and resistance levels, and much more. When combined with other tools can provide safe, and conservative trading signals.
Depending on the timeframes used, shorter or longer-term trends can be analyzed individually or side by side on the same price chart for even more data to review and compare.
Types of Moving Averages
There is a variety of Moving Average types designed to meet a certain goal and provide specific data to market analysts. Each one has its own formula for calculating each Moving Average type. Experimenting with different types of Moving Averages cross different timeframes can produce unique results.
1. Simple Moving Average
The Simple Moving Average or SMA is an unweighted mean of previous data. This method involves calculating each successive value into the average, dropping the oldest value recorded to form the new Simple Moving Average.
2. Cumulative Moving Average
Cumulative Moving Averages include all data up until a certain point specified by the trader. For example, a trader may want to view the Moving Average starting at a certain data, such as the first of a month or calendar year, to get Cumulative Moving Average based on all the data from that point forward, leading up to the current timeframe. With Cumulative Moving Averages, the older data doesn’t fall off and is instead added to the cumulative average.
3. Weighted Moving Average
Weighted Moving Averages act much like the SMA, but has additional factors involved that multiply the data to apply different weights to the data. The weighted average is a convolution of the various data points with a fixed weighting applied. These weights in financial markets are often used to decrease the mathematical progression of the calculation.
4. Exponential Moving Average
Much like the Weighted Moving Average, an Exponential Moving Average or EMA, is an average of data points with weighting factored into the calculation. However, with an Exponential Moving Average, the decrease in mathematical progression decreases exponentially, but never reaches zero.
5. Displaced Moving Average
Displaced Moving Averages are designed to provide a trader with more accurate forecasts of potential trends, signal overbought and oversold levels, and much more. These Moving Averages are adjusted forward or backward in the indicator settings time to produce more accurate results.
How the Moving Average Works
The Moving Average works by averaging out data points across specified timeframes. Traders can set the timeframe specifically to watch for signals related to short-term, mid-term, or long-term trends.
These averages often provide an unbiased and clear look at price action without the regular ebb and flow of market chop from assets attempting to form a trend.
This data is used to offer a visualized mean representing the data points averaged out across stock charts. Visually, the data is easier to interpret and derive signals from, which can help give traders a competitive edge in the market and make generating profit regularly that much easier.
The Calculation of the Moving Averages
Because there are many types of Moving Averages, there are also many ways to calculate each Moving Average Type. Each formula and calculation can be found before for each type of Moving Average.
Simple Moving Average
The Simple Moving Average is also referred to at the SMA. The calculation for finding the Simple Moving Average is:
SMA = A1 + A2 + … + An / nWhere:
A = average in period n
n = number of time periods averaged out
Cumulative Moving Average
The Cumulative Moving Average or CMA uses the following calculation:
CMAn = X1 + … Xn / nWeighted Moving Average
Weighted Moving Averages can be found using by calculating:
WMAm = nPM + (n - 1)PM-1 + … + 2P(M - n + 2) + P(M - n + 1) / n + (n -1) + … +2 +1Exponential Moving Average
The Exponential Moving Average or EMA can be calculated using the following formula:
EMAt = [Vt x (s / 1 + d)] + EMAy x [1 – (s / 1 + d)]
Where:
EMAt = EMA Today
Vt = Value Today
EMAy = EMA Yesterday
s = smoothing
d = number of days
Displaced Moving Average
No additional calculations are required for the Displaced Moving Average, or DMA, the time periods included are just adjusted manually by the trader.
How to Read Moving Averages
Moving Averages are among the most simple to read out of all technical analysis indicators commonly used today, as they are represented visually with a line that trends up or down with price action.
These Moving Averages can be used to not only discover when trends are turning or changing but can act as a base for support or level of resistance for assets to overcome. When more than one Moving Average is combined, the results can lead to a large sum of money being made on each successful trade and should be a regular cornerstone of any trader’s trading system.
How to Use Moving Averages
Moving Averages can provide buy or sell signals when the Moving Average turns up or down. Crosses of important short-term and long-term Moving Averages called golden or death crosses often signal to investors what the long-term health of an asset looks like at a glance.
Moving Averages also act as support and resistance, signaling that support has been found after a decline and average loss in an asset’s price, and signaling where a rally may fall victim to too strong of resistance.
When combined with other charting tools and indicators, Moving Averages can help confirm other signals for a winning combination for traders to profit using.
Best Moving Average Trading Strategies
While Moving Averages can be set at nearly any interval imaginable, over time traders have come to rely on very specific timeframes across the short-, medium-, and long-term. The most commonly used Moving Averages include the 50MA, 100MA, and 200MA, representing short-, medium-, and long-term ranges.
Many of the best and most successful trading strategies involved these three Moving Averages, but traders are advised to experiment with a variety of timeframes and Moving Average types to discover what works best for them. Finding what works best for each individual situation will result in the greatest profit and smallest average loss.
1. Buy or Sell Signals When Price Passes Through Moving Averages
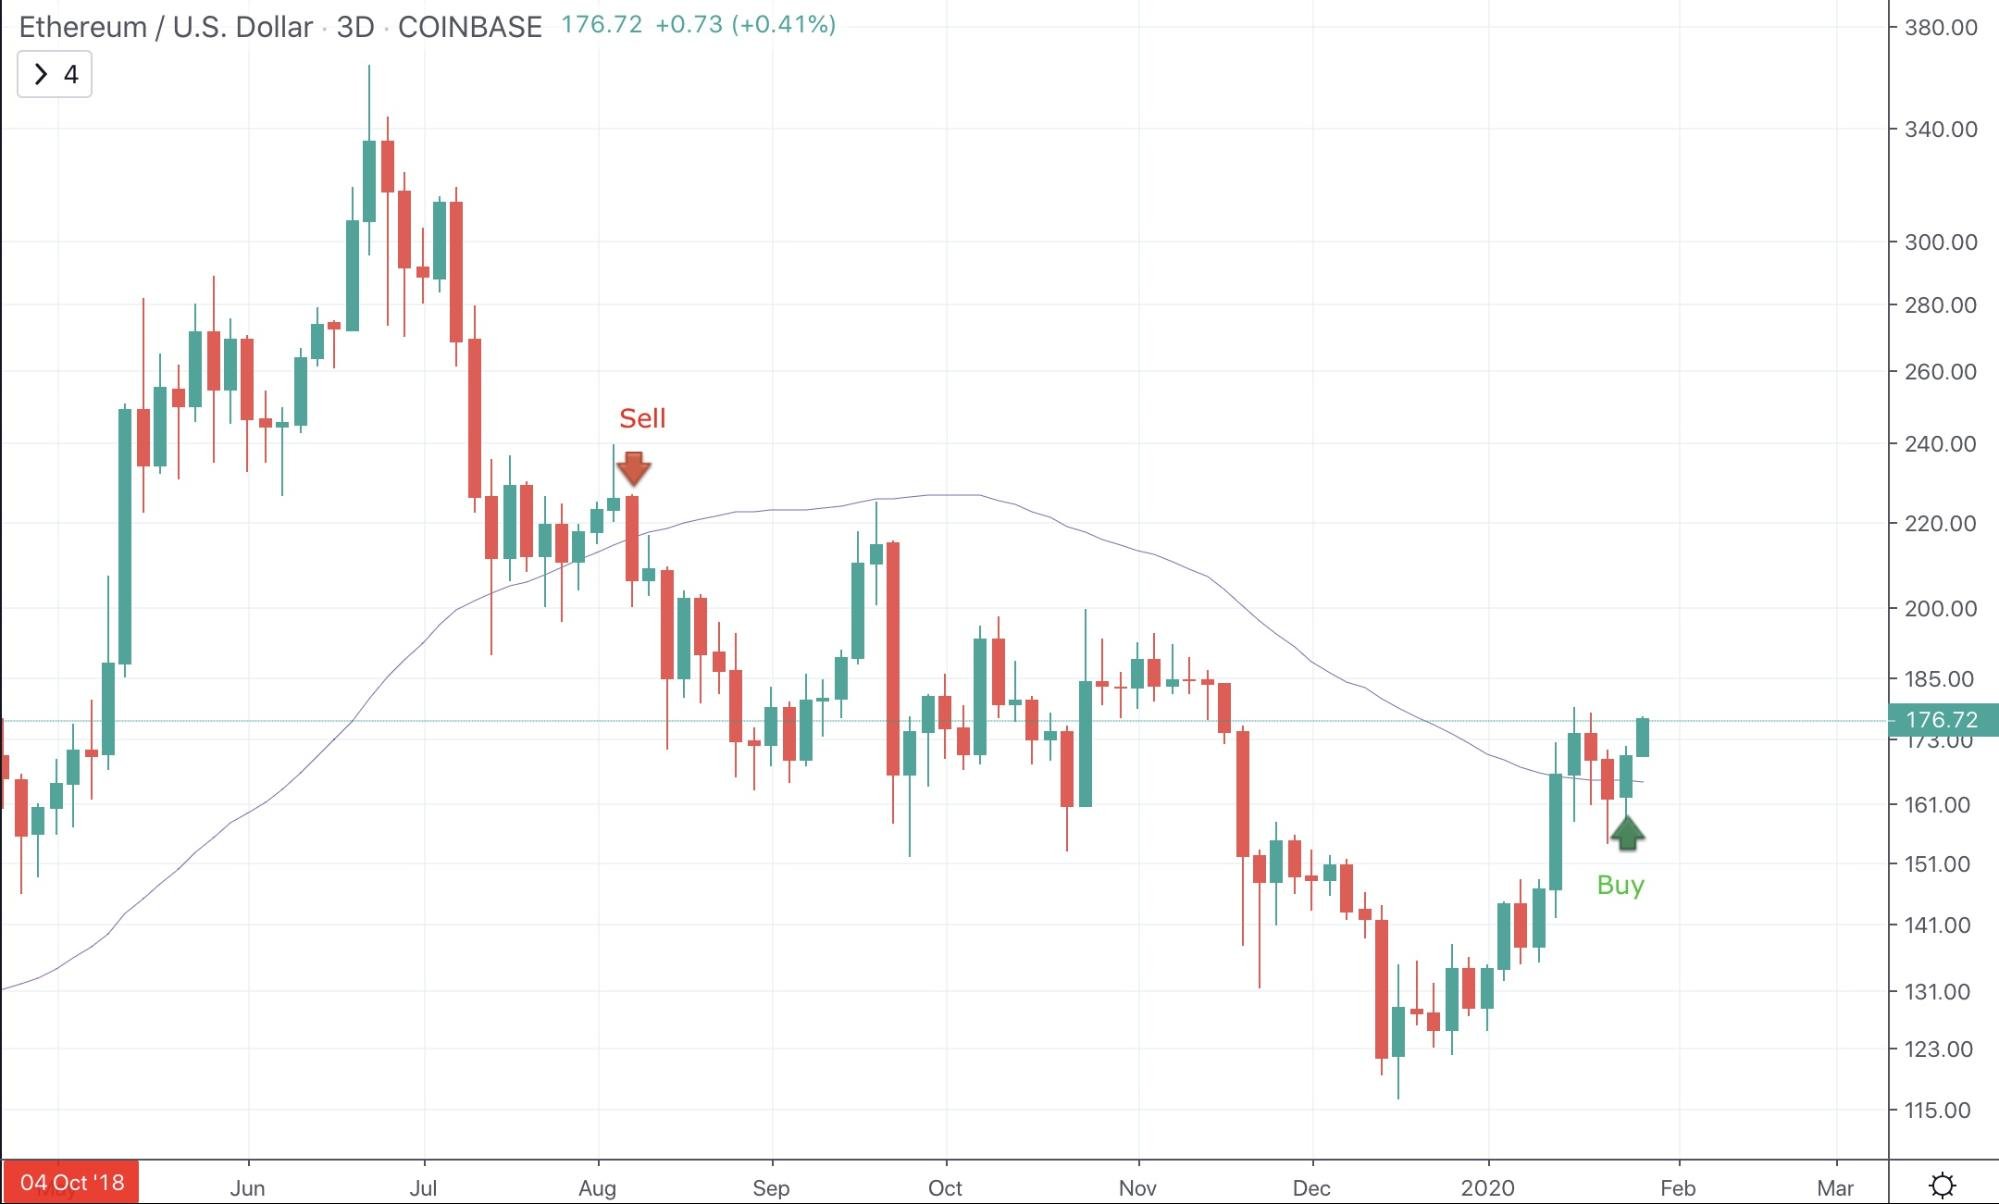
When the price of an asset passed through a Moving Average it acts as a buy or sell signal, depending on the direction of a break of the line.
In the below example, Ethereum’s price can be seen falling through the 50MA on 3D timeframes, resulting in a six-month-long downtrend. Once the asset broke back above the 50MA and held it as support, a new uptrend is confirmed.
2. Buying Long-Term Moving Average Support
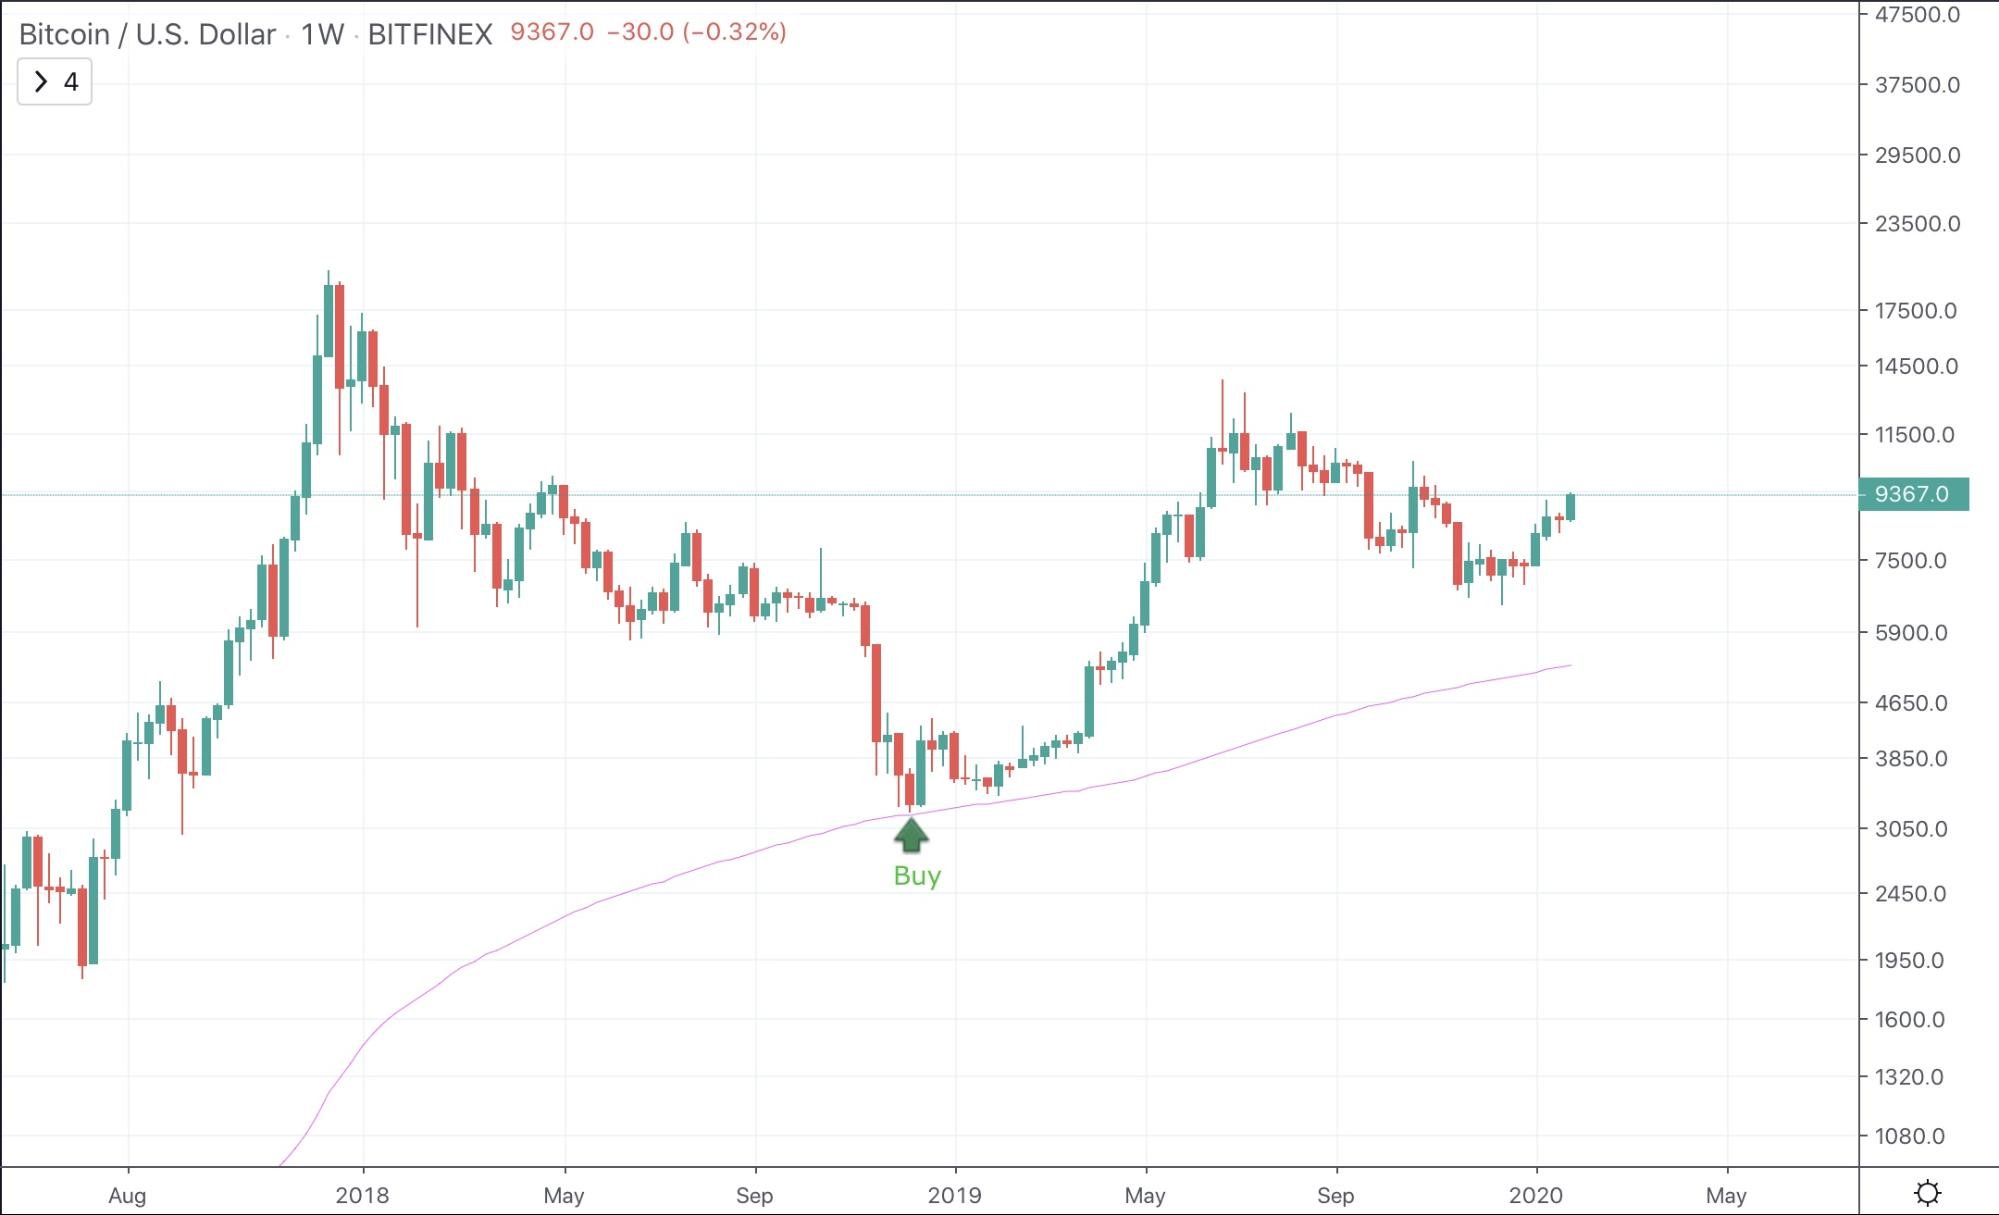
The 200MA is among one institutional investors use to signal when an asset may find support after an extended downtrend. This Moving Average often provides an extremely strong buy signal if it holds. A break below it, however, could be disastrous.
In the below Bitcoin price chart, the 200-week Moving Average acted as support and a buy signal that caused Bitcoin to bottom and a new uptrend to begin.
3. Selling a Death Cross Moving Average Crossover
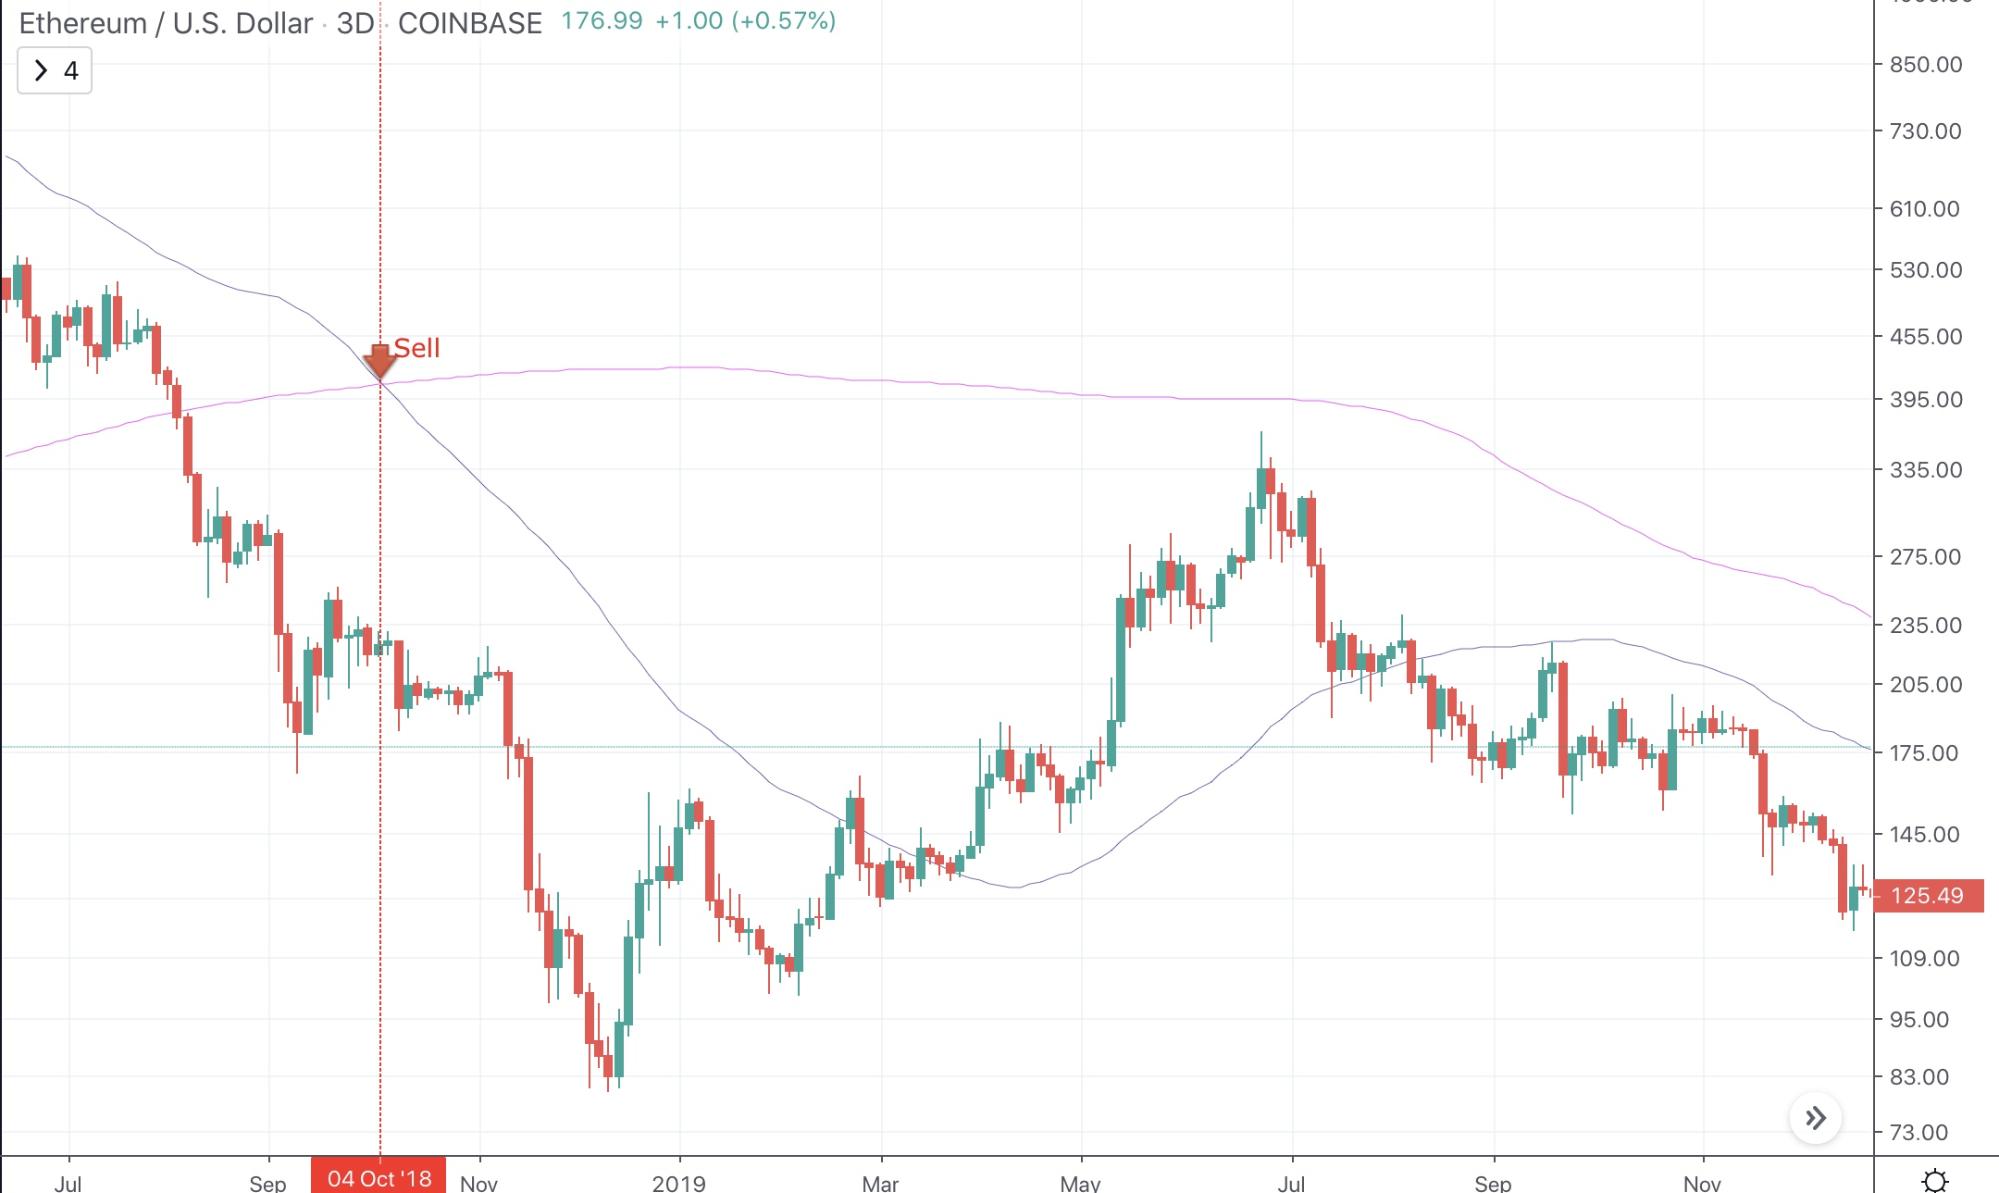
Death Crosses are as ominous as they sound, and often tell traders that an extended downtrend is coming.
In the below chart, the Moving Average crossover occurs with the short-term Moving Average falling below the long-term Moving Average, resulting in a Death Cross and sell signal.
4. Buying a Golden Cross Moving Average Crossover
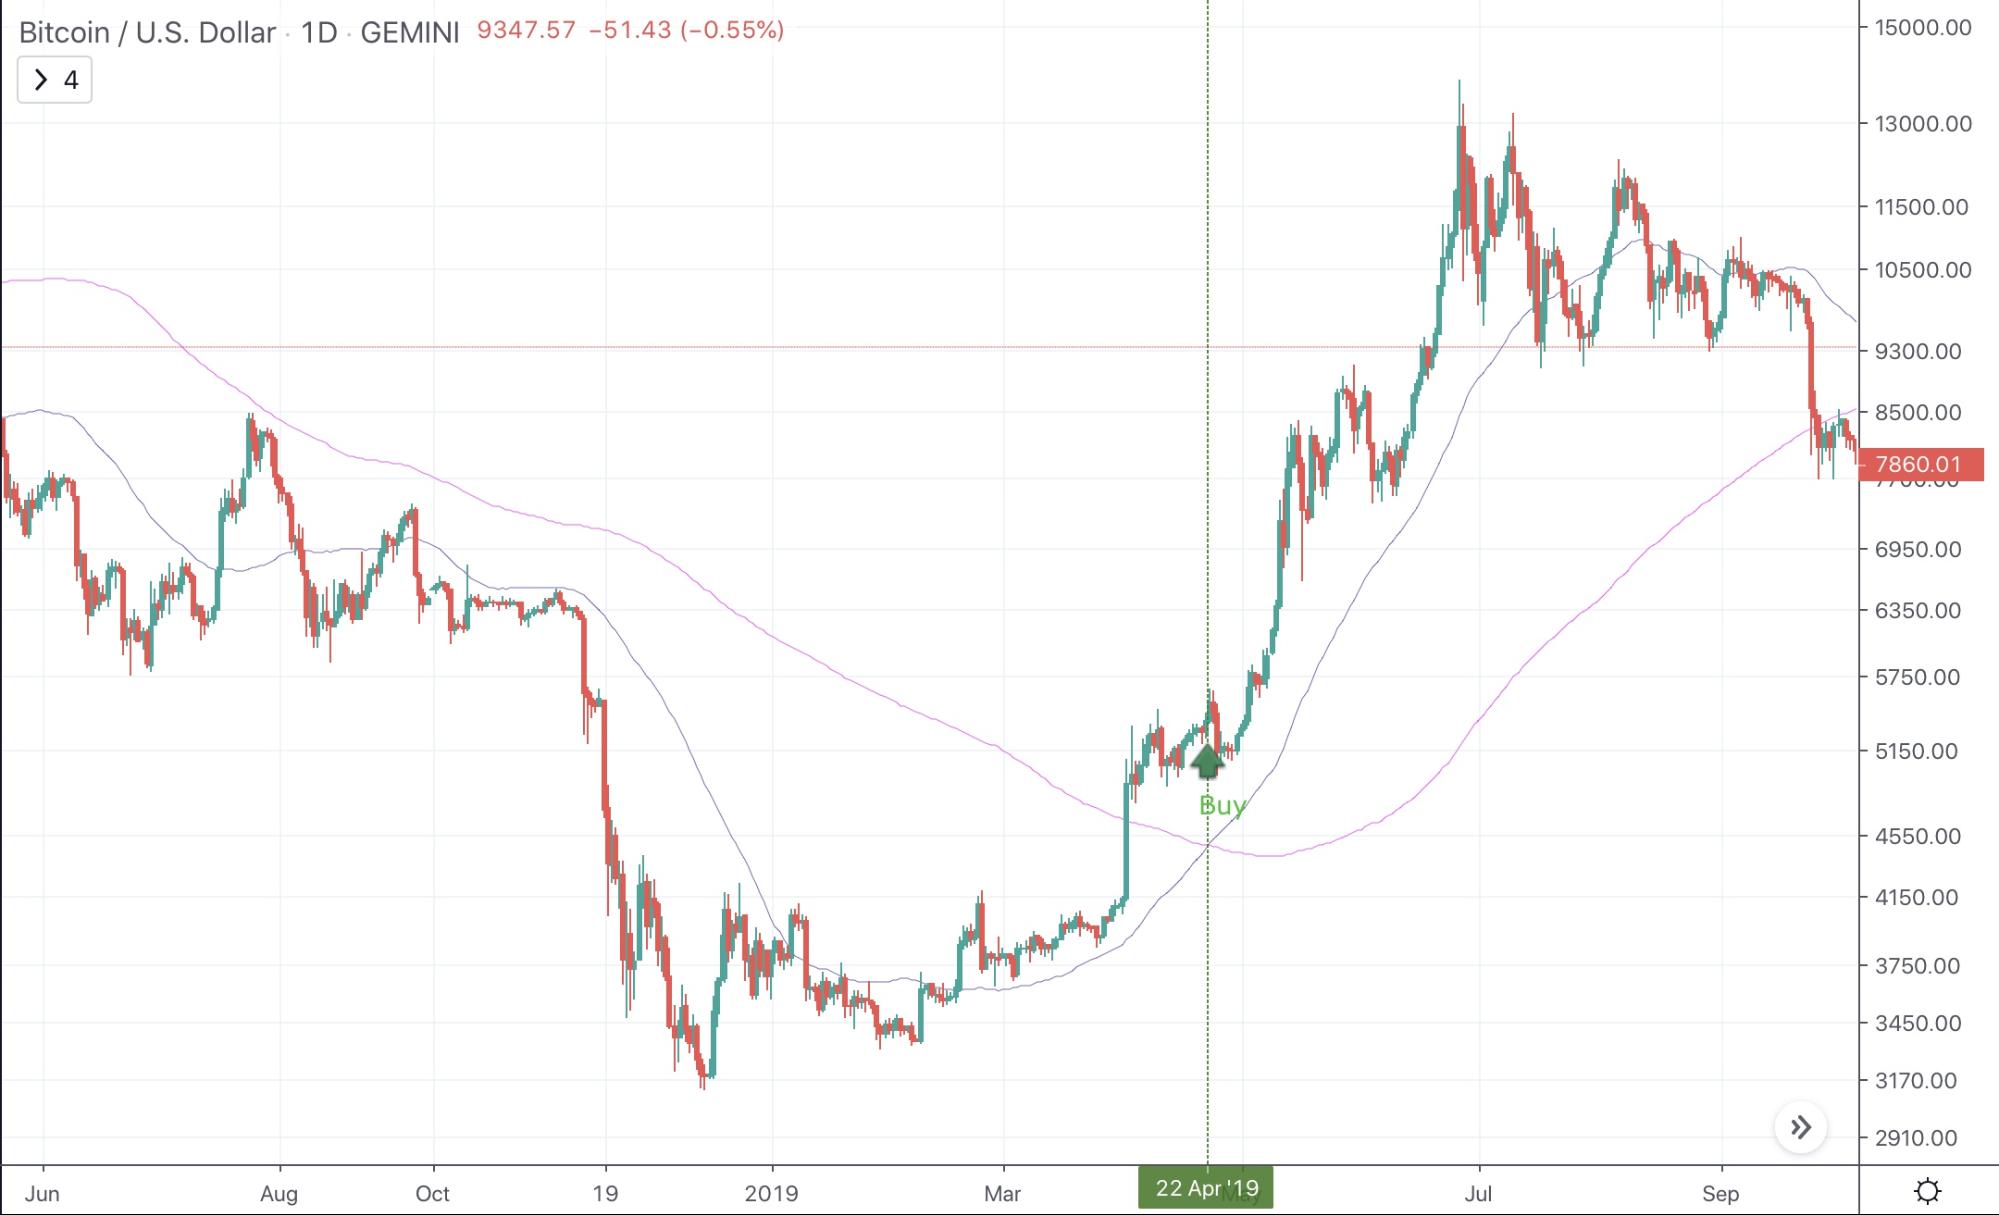
Because the 200-day Moving Average chart is among the most important, traders watch closely for when the 50-day Moving Average crosses above the line, causing what traders call a Golden Cross.
A Golden Cross is a powerfully bullish buy signal that a new uptrend is forming. In the chart below, the 50-day Moving Average can be seen crossing over the 200-day Moving Average, signaling that a new uptrend is starting.
5. Discover Trading Ranges When Price is Trapped Between Moving Averages
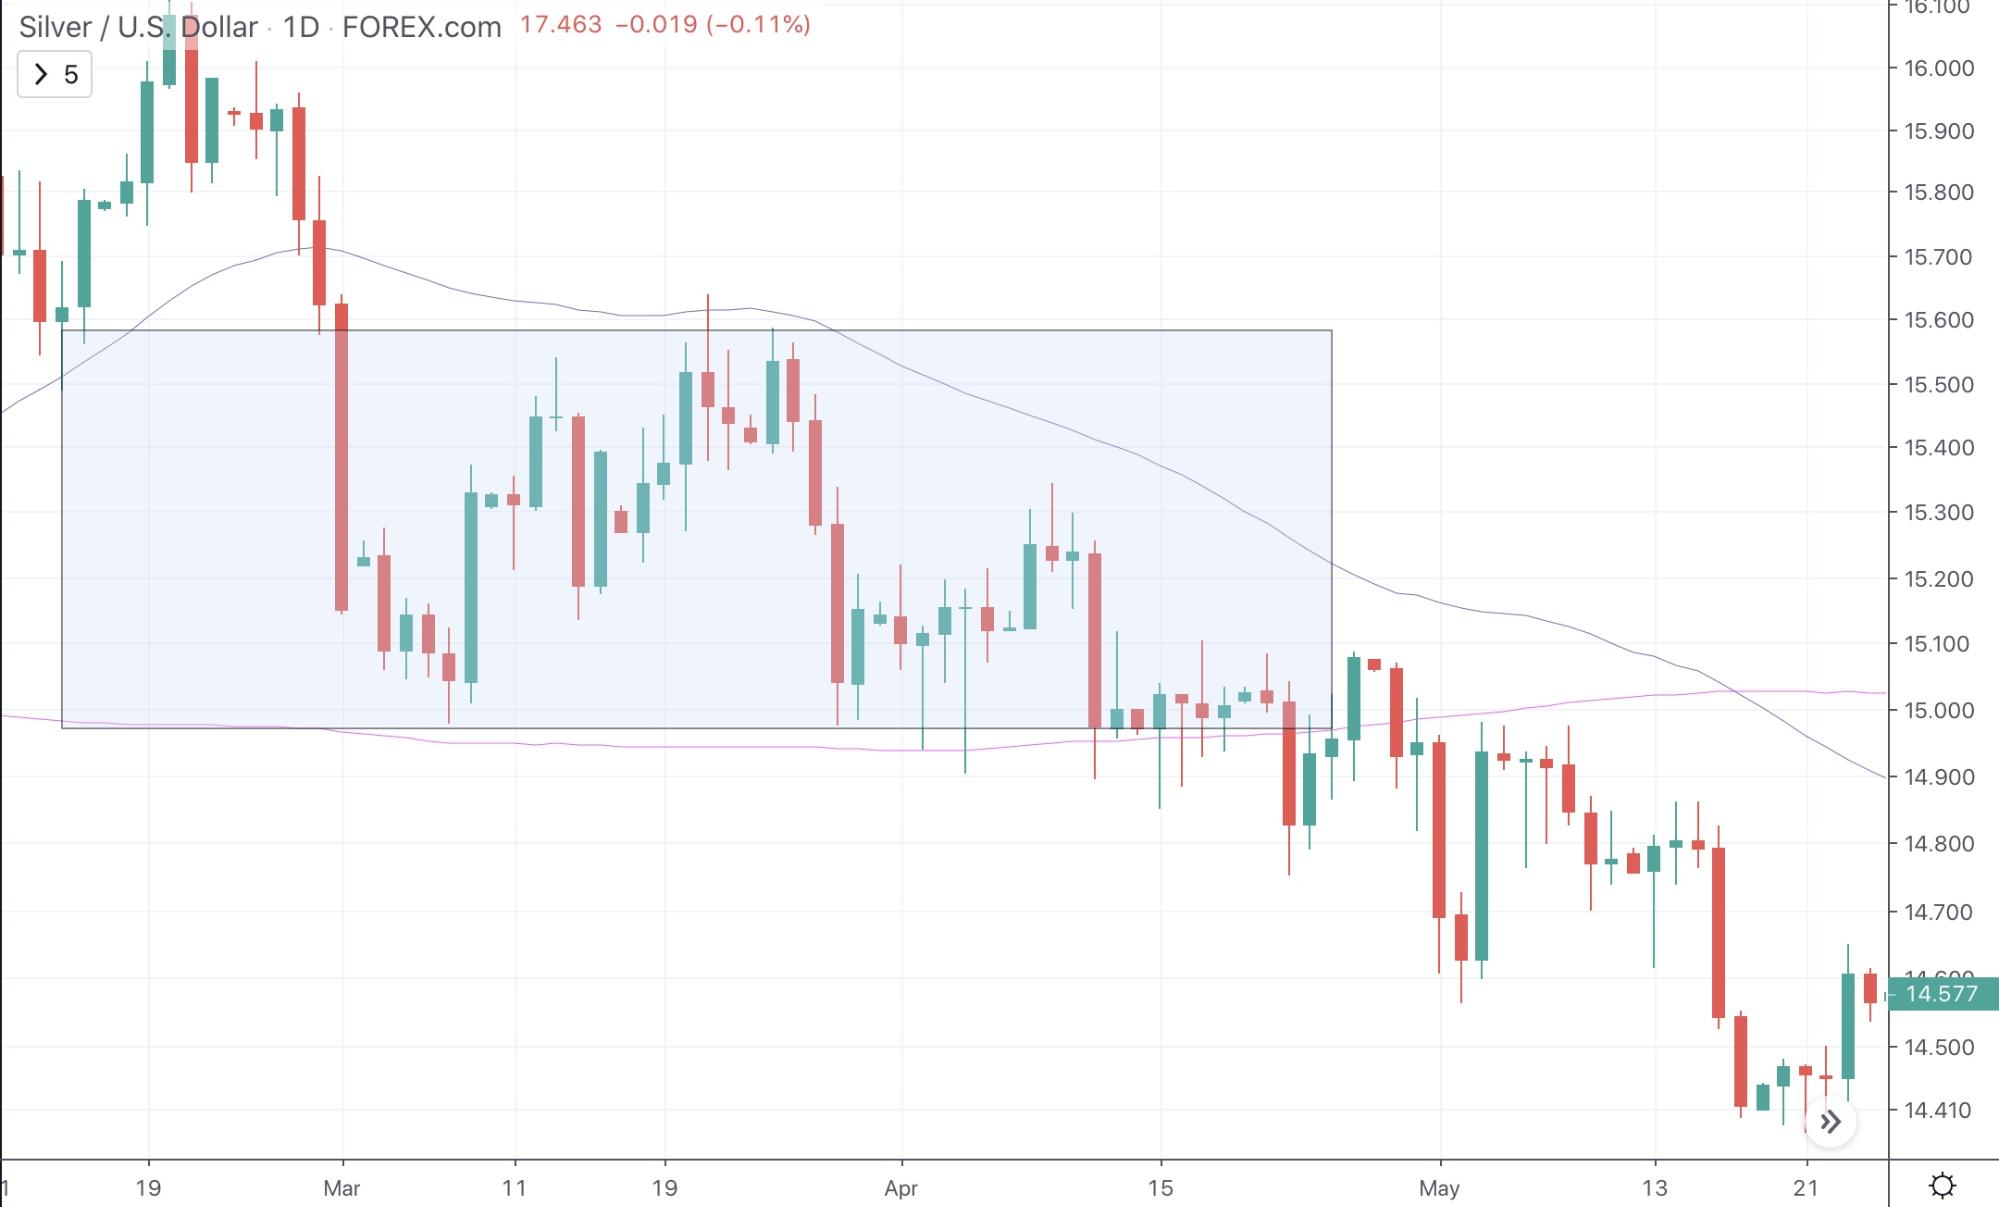
Because Moving Averages can act as both support and resistance, when the price gets trapped between two important Moving Averages, if often signals consolidation and a tight trading range before a break to either side.
In the below example using the Silver/USD daily price chart, it demonstrates how price becoming sandwich between two critical Moving Averages results in a ranging market, waiting for the asset to choose a new trend.
6. Combining Moving Averages To Confirm Other Indicator Signals
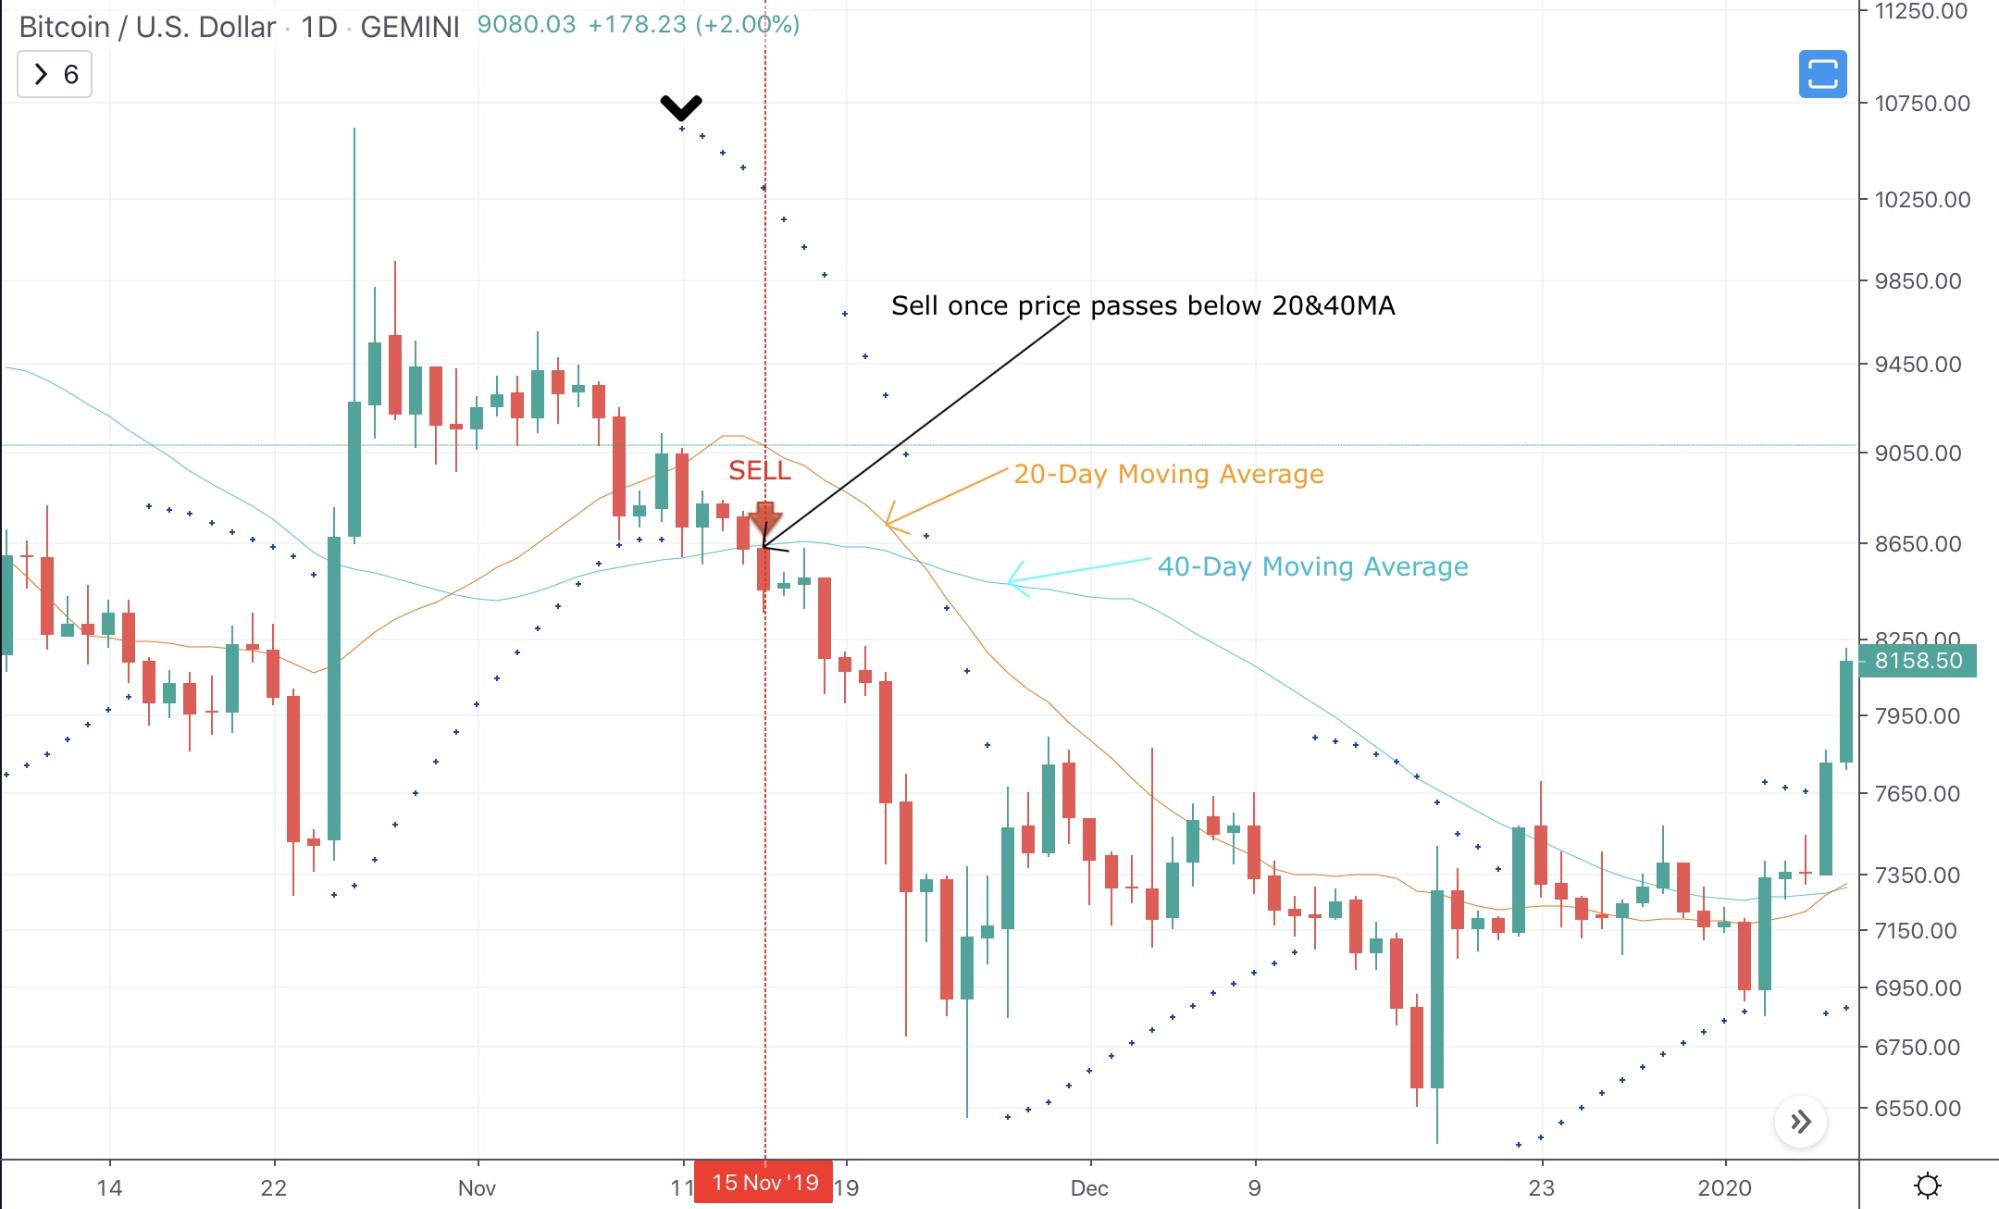
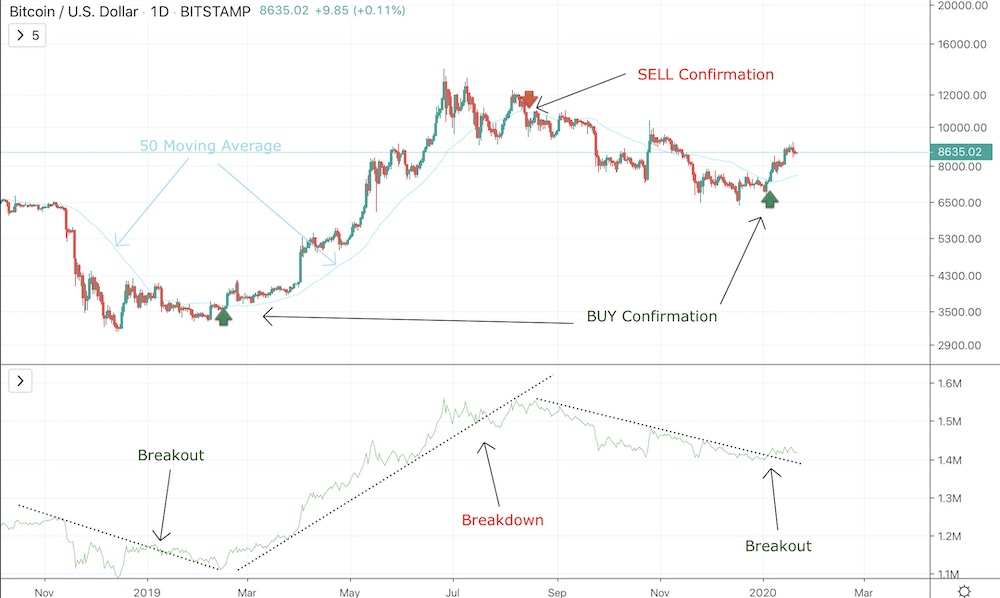
Moving Averages can also be combined with other tools for more conservative trading methods. The idea is that one indicator confirms the other, resulting in safer entries and more profitable exits.
In the first example below, Moving Averages are combined with the Parabolic SAR to filter out false readings. In the second example, Moving Averages are combined with On-Balance Volume to provide early signal confirmations that can tell a trader to take action.
Tips for Traders and Common Mistakes
Moving Averages are viewed as lagging indicators, so they can sometimes provide false signals. Combining Moving Averages with chart patterns, candlestick formations, or other technical analysis indicators such as the Relative Strength Index, MACD, Parabolic SAR, and more can result in safer entries and more successful trading strategies.
Traders are encouraged to experiment with each type of Moving Average and at different intervals. Each asset and market reacts differently to price action and has a unique price history. This makes each Moving Average also unique to each asset’s price chart, so different timeframes may work better depending on the asset analyzed.
Conclusion
Now that we’ve explained what is a Moving Average and how to use Moving Averages, you are now ready to try trading yourself using signals derived from Moving Averages.
Moving Averages are just one of many profit-generating tools found on Flurex Option, including built-in charting software, advanced protection orders, and up to 1000x leverage on forex, commodities, stock indices, and crypto.
These powerful tools can help a trader grow their profits and increase their capital to new heights with very little practice and a small amount of initial starting capital.
Flurex Option offers helpful tutorials and more educational reference materials to get you started on your way to success. Sign up today for a free demo account or register for a trading account in less than 60 seconds. With no KYC required, low fees, and a low minimum deposit, Flurex Option is the best one-stop-shop for traders new and experienced.
