The cup-and-handle pattern, a powerful price pattern in technical analysis, can help you to make more informed trading decisions. With its ability to identify potential trading opportunities and signal a bullish continuation pattern, understanding this pattern is crucial for traders seeking an edge in the market. By understanding the ins and outs of the cup-and-handle pattern, traders can navigate with confidence and precision, maximizing their chances of success.
Understanding Chart Patterns in Trading
Chart patterns, which are frequently employed in analysis, are graphic representations of price changes in financial markets. They assist forecast future price fluctuations and offer insights into the actions of market participants.
The market’s interaction of supply and demand forces results in the formation of patterns. Different timescales, such as daily, weekly, or monthly charts, may show these patterns. These patterns are investigated by traders and analysts in order to spot prospective trading opportunities.
Patterns are important because they can show probable trend reversals, continuation patterns, or levels of support and resistance. By identifying these patterns, traders can predict the potential direction of price movement and take the necessary steps to acquire or sell assets. In this case, we are looking at a bullish continuation pattern.
Decoding the Cup-and-Handle Pattern
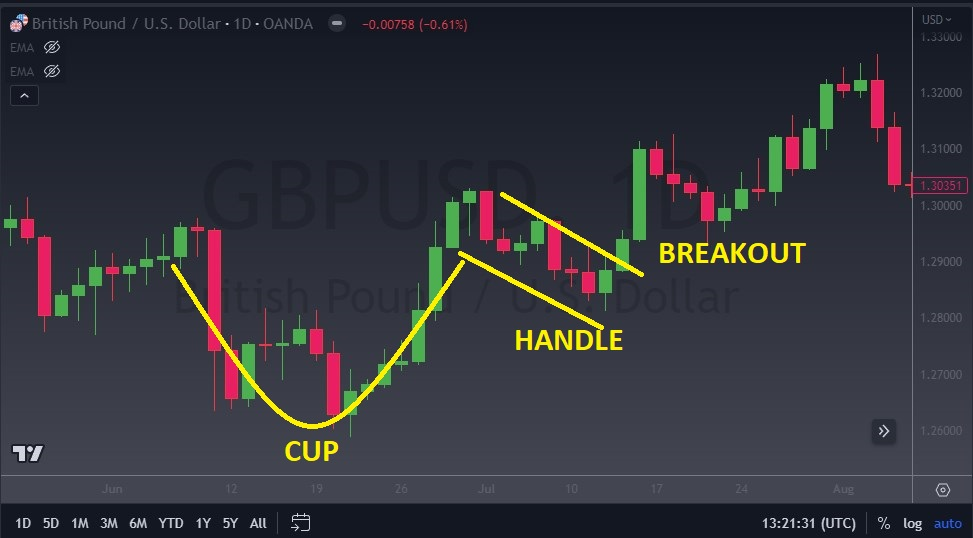
A chart pattern called the cup-and-handle appears during an upswing and suggests that price movement may resume in an upward direction. The cup, the handle, and the breakout are its three basic parts.
The Cup: The Cup, the initial component of the design, has a rounded bottom or a “U” form. It takes the shape of a circular or saucer-like pattern as a result of a steady price decrease followed by a gradual recovery. The cup symbolizes a time of stability or a little break in the upward trend.
The Handle: The handle, which is the second component of the pattern, manifests as a slight price fall following the cup formation. It resembles a flag pattern or a brief channel with a downward slope. Compared to the cup, the handle often has a lesser trading volume. The handle suggests the possible breakout is approaching its final stage of consolidation.
The Breakout: The cup-and-handle pattern’s pivotal occurrence is known as the breakout. It happens when the price moves above the resistance level created by the cup’s high point. This breakout supports the pattern and signals that the prior upward trend will continue. When the breakout occurs, traders frequently watch for a substantial increase in trading volume since it provides additional confirmation.

A U shaped cup started the move higher.
The ‘Cup’ in Detail
The formation of the “cup pattern” in the cup-and-handle pattern is a crucial component that holds significance in identifying and confirming the pattern. The ‘cup’ represents a period of consolidation or a temporary pause in an upward trend.
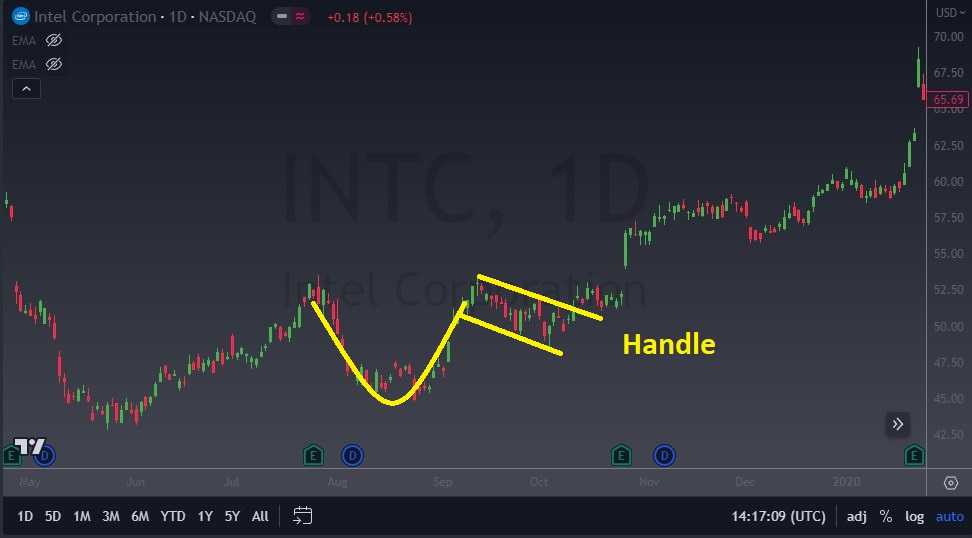
The formation of the cup typically begins with a gradual decline in price as sellers exert pressure on the market. This decline forms the left side of the cup. As the selling pressure subsides, buyers step in and gradually push the price higher, forming the right side of the cup. The pattern resembles a rounded or saucer-like shape, hence the name ‘cup.’ A “U shaped cup” is preferable.
The significance of the cup lies in its representation of a shift in market sentiment. During the formation of the cup, buyers gradually regain control, resulting in a recovery of prices. This indicates that the selling pressure has diminished, and bullish sentiment is emerging.

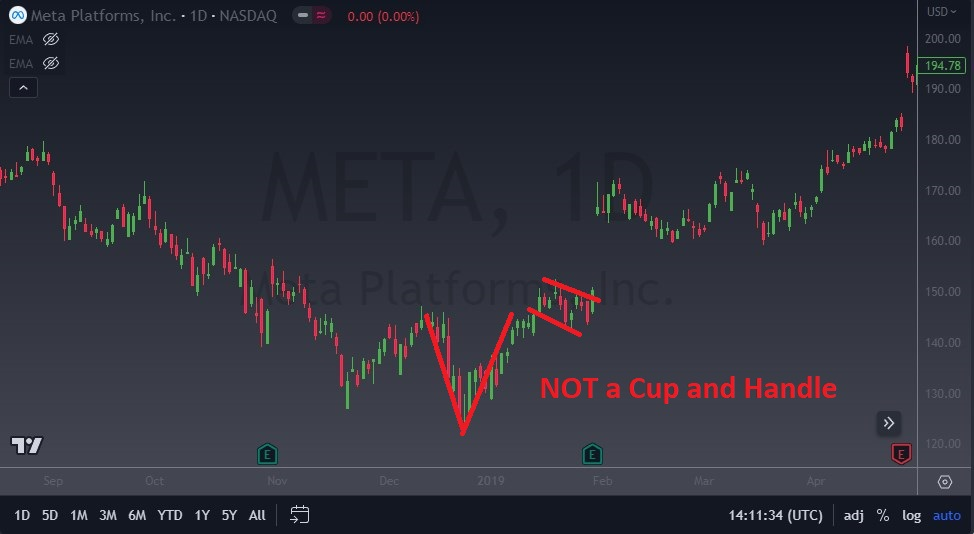
While the chart pattern forms similarly on the chart above to a cup and handle pattern, it has too much of a “V” when the cup forms.
The depth and shape of the cup are also important factors to consider. A deeper cup suggests a more prolonged consolidation period, indicating stronger accumulation and potential for a significant breakout. A shallower cup may imply a shorter consolidation period with less bullish conviction.
Traders and analysts look for specific characteristics in the cup formation to confirm its validity. These include a smooth and rounded shape without sharp price spikes or excessive volatility. A cup with a more gradual and rounded shape is generally considered more reliable.
The ‘Handle’ in Detail
The ‘handle’ is the second component of the cup-and-handle pattern and plays a significant role in confirming the pattern and signaling a potential breakout. It appears as a small decline or consolidation in price after the formation of the cup.
After the completion of the cup formation, which represents a period of consolidation and bullish sentiment, the handle emerges as a short-term pullback in price. The handle is characterized by a downward sloping channel or a flag pattern.
The handle serves as a final period of consolidation before the potential breakout. It indicates that the market is taking a breather after the upward move seen in the cup formation. The handle typically exhibits lower trading volume compared to the cup.
The length and duration of the handle can vary. It is generally shorter in duration compared to the cup and can last anywhere from a few days to several weeks. The handle should ideally retrace a relatively small portion of the cup’s upward move, typically not more than one-third of the cup’s depth.

The significance of the handle lies in its role as a confirmation signal for the cup-and-handle pattern. Traders closely observe the handle to validate the pattern before considering potential trades. Once the handle is formed, traders anticipate a breakout above the resistance level established by the high point of the cup.
It’s worth noting that the handle should exhibit certain characteristics to strengthen the pattern’s validity. These include a relatively smooth and gradual decline in price, low trading volume, and a distinct visual separation from the cup formation.
By recognizing and analyzing the handle formation in the cup-and-handle pattern, traders can better time their entry into the market, placing buy orders above the resistance level once the breakout occurs.
How to Spot a Cup-and-Handle Pattern
Use these rules to spot the cup-and-handle pattern:
Look for a prior uptrend: Make sure there was a definite upward price movement prior to the pattern creation. The cup-and-handle pattern forms during an uptrend.
Find the cup-shaped formation: On the price chart, look for a rounded or saucer-shaped form to indicate a time of consolidation. The cup’s right side illustrates a progressive recovery, while the left side shows a gradual deterioration.
Confirm the handle: After the cup formation, look for the handle, which is a brief price decline. It must visually differ from the cup formation and display a flag design or a downward sloping channel.
Consider volume: When a cup forms, volume is usually higher during the drop and lower during the recovery. Compared to the cup, the handle should have a smaller trading volume.
Common errors and misunderstandings:
Premature identification: Don’t judge the cup-and-handle pattern as legitimate before it has fully formed. Early identification could result in erroneous signals and poor trading choices.
Overlapping patterns: Check for any overlaps between the handle and other patterns like triangles or flags. The cup-and-handle motif might be difficult to interpret when there are overlapping patterns.
Insufficient volume analysis: While decreased volume during the handle development is typical, you should exercise caution if it occurs. The pattern may be thrown off by strange loudness patterns.
Ignoring the larger market context: Take into account both the cup-and-handle pattern and the general market trend. Don’t base all of your trading decisions exclusively on this trend.
To maximize the reliability of the cup-and-handle pattern, keep in mind that it should be utilized in conjunction with other analysis techniques.
Avoiding False Signals
False signals are part of trading. This is true when any pattern forms, including the cup and handle. There are a few things you can do to increase your odds though. This includes checking for increasing volume on the breakout, a retest of teh previous resistance as support on a pullback, and using oscillators such as the MACD in concert with the pattern breakout.
Trading the Cup-and-Handle Pattern
Having a balanced approach and taking into account numerous scenarios are crucial when employing the cup and handle pattern to make trading decisions. Here is a list of potential points of entry and exit:
Entry points
Wait for a clear breakout over the resistance level produced by the high point of the cup before entering a trade. When the price convincingly moves above this level, preferably with high trading volume, enter a long position.
If a breakthrough has already taken place, an alternative strategy is to wait for a pullback to the breakout level or the handle’s low.
Stop-Loss points
Put the stop-loss order below the handle’s low point. This level serves as a support area, and if the price falls below it, the pattern may become invalid.
As the price increases in your favor, adjust the stop-loss order, trailing it to preserve gains and curtail prospective losses. Think about employing moving averages or trailing stop orders as dynamic stop-loss levels.
Price Target/exit points
The depth of the cup from the bottom to the rim should be measured, then projected upward from the breakout point. This can act as a goal or a partial price target point where some gains can be realized.
Consider them as potential exit points by identifying strong resistance levels, such as past swing highs or psychological levels. At these levels, the price may experience selling pressure or more resistance.
When the price begins to reverse or exhibit signs of weakness, use trailing stops to allow profits run and close the position.
Comparative Analysis: Cup-and-Handle Vs. Other Patterns
The cup-and-handle pattern’s distinctive benefits and potential drawbacks can be brought out by contrasting it with other prevalent patterns:
The cup-and-handle pattern has some advantages
- Continuation Pattern: A likely continuation of the prior trend is indicated by the cup-and-handle pattern, which is primarily a continuation pattern. For traders trying to profit from continued positive trends, this is advantageous.
- Visual Clarity: The pattern is quite simple to recognize visually due to the rounded shape of the cup and the distinct separation of the handle.
- Gradual Accumulation: The cup pattern denotes a time of slow accumulation or buying pressure, maybe pointing to a more solid base for the bullish trend.
- Objective Entry and Stop-Loss Levels: For managing risk, the breakout level serves as a precise stop-loss level, while the handle’s low serves as an objective entry level.
Problems with the Cup-and-Handle Pattern
- False Breakouts: Although the cup-and-handle pattern points to a possible breakout, there is still a chance that the price will not hold above the resistance level, leading to a false breakout. Traders should exercise caution and wait for additional price confirmation.
- Subjectivity in Pattern Interpretation: The cup-and-handle pattern can be difficult to recognize and depict, which can lead to different interpretations among traders. Decision-making could be biased or inconsistent as a result of this subjectivity.
- Limited Application in Bearish Trends: The cup-and-handle pattern has limited use in bearish trends; it works best in bullish ones. When the market is negative, it might not give accurate indications or still be effective.
- Overlapping Patterns: The cup-and-handle pattern can overlap or merge with other patterns, making it challenging to isolate its specific signals. Traders should be aware of the potential for multiple patterns influencing price action simultaneously.
Impact of Market Conditions on the Cup-and-Handle Pattern
Different market conditions can significantly impact the formation and reliability of the cup and handle pattern. Here’s how various market conditions can influence the pattern:
- Strong and Healthy Trend: In a strong and healthy bullish trend, the cup and handle pattern tends to form more reliably. The cup formation exhibits a clear period of consolidation and accumulation, indicating sustained buying pressure. The handle formation is typically smaller and shows a temporary pause before the upward trend resumes. Breakouts from this pattern in a strong trend are more likely to result in continuation.
- Volatility and Choppiness: During periods of high volatility or choppiness in the market, the cup and handle pattern may form less precisely. Price fluctuations can be irregular, making it challenging to identify a distinct cup shape or handle formation. False breakouts and whipsaw movements can occur more frequently, reducing the pattern’s reliability.
- Extended Sideways or Range-bound Markets: In extended sideways or range-bound markets, the cup and handle pattern may form but could be less reliable. The cup formation may be less pronounced, reflecting prolonged consolidation without a clear bullish bias.
- Bearish Market Conditions: The cup and handle pattern is primarily a bullish continuation pattern, so its reliability diminishes in bearish market conditions. In downtrends, the cup formation may be inverted or exhibit a bearish bias, making it less effective as a bullish pattern.
It’s important to adapt trading strategies and combine the cup and handle pattern with other technical analysis tools to increase reliability. Always consider the specific market conditions and adjust risk management strategies accordingly.
Limitations and Risks of the Cup-and-Handle Pattern
Although the cup and handle pattern can be a useful tool in technical analysis, it’s crucial to be aware of its limits and the risks involved in using it exclusively to make trading choices. Here are some things to think about:
- False signals: The cup and handle pattern is not infallible, just like any other chart pattern. If traders only base their trading decisions on this pattern, false signals may appear, potentially resulting in losses. The pattern must be verified using additional technical indicators and analysis tools.
- Subjectivity: To some extent, how cup and handle patterns are interpreted might be subjective. Different traders may arrive to different conclusions depending on the precise dimensions of the cup or handle. This subjectivity may result in biases and have an impact on trading decisions.
- Market circumstances: Depending on the circumstances, the cup and handle pattern may or may not be useful. The pattern might not offer accurate signals when the market is volatile or behaves in an unforeseen way.
- Overlapping patterns: The cup and handle pattern can occasionally blend or overlap with other patterns, making it challenging to distinguish its unique signals. The prospect of numerous patterns impacting price behavior at once should make traders cautious.
- False breakouts: False breakouts are a possibility, even if the cup and handle pattern seems to be reliable. A prolonged upward movement is not guaranteed by a breakout over the resistance level. In order to limit potential losses in the event of false breakouts, traders should employ the proper risk management techniques, such as stop-loss orders.
Interplay with Other Indicators
Other technical analysis indicators can be added to the cup-and-handle pattern to improve its ability to produce trustworthy trade signals:
- Volume indicators: Comparing the cup-and-handle pattern with volume analysis can reveal important information. Watch for more volume during the decline of the cup formation and decreased volume during the rebound. A spike in volume during the breakout can support the legitimacy of the pattern even further.
- Moving averages: Use moving averages to determine the overall trend and probable levels of support and resistance on the price chart. The cup-and-handle pattern’s bullish indication may be strengthened by the crossing of moving averages or by the price rising above a moving average.
- Relative Strength Index (RSI): Use the relative strength index (RSI) indicator to gauge how strong the price movement is. The possible breakout signal can be strengthened if the cup-and-handle pattern is confirmed by bullish RSI divergence, when the RSI makes higher lows while the price makes lower lows.
- Fibonacci retracement levels: Applying Fibonacci retracement levels to the cup-and-handle pattern will help you find probable support levels. If the handle reverses to a significant Fibonacci level, such as 38.2% or 50%, it strengthens the support zone and adds confluence to the pattern.
- Confirmation from other patterns: Look for additional patterns that match the cup-and-handle pattern, such as bullish engulfing patterns or positive candlestick formations, to provide extra confirmation. The reliability of the trading signal is increased when many patterns with the same bullish bias are present.
Tools and Resources for Spotting the Cup-and-Handle Pattern
Utilize popular charting platforms like the Flurex Option trading platform, TradingView, StockCharts, or MetaTrader, which offer a wide range of technical analysis tools and indicators.
Refer to books written by experienced traders and technical analysts that cover chart formations. Some recommended books include “Technical Analysis of the Financial Markets” by John J. Murphy, “Encyclopedia of Chart Patterns” by Thomas N. Bulkowski, and “Technical Analysis Using Multiple Timeframes” by Brian Shannon.
Conclusion: Mastering the Cup-and-Handle Pattern for Effective Trading
In conclusion, understanding the cup-and-handle pattern is a valuable tool for traders. By accurately identifying and interpreting this pattern, traders can enhance their trading decisions. However, it’s important to be mindful of false signals, market conditions, and the need for additional analysis. Utilizing the pattern in conjunction with other indicators can strengthen trading signals. Overall, the cup-and-handle pattern provides insights into potential trading opportunities and continuation of bullish trends.
Is cup and handle a bullish pattern?
Yes, it suggests that the market is building pressure to go higher after consolidation.
What is a proper cup and handle pattern?
One when a cup forms a "U" pattern, and then a handle.
What usually happens after a cup and handle?
Typically, the market will move to higher prices, as the bottoming process is done.
Is cup and handle pattern effective?
Yes, it can be. However, make sure to use other technical indicators such as volume to confirm.


